分面让一张图拆成多个子图,帮助我们比较不同分组的趋势与分布差异。
分面概念速览
- 分面会根据变量的取值将数据拆成多个子集。
- 每个子图共享同一绘图语法,便于观察模式是否一致。
facet_wrap() 适合一维分组,facet_grid() 用于二维交叉分组。
facet_wrap:一维分组的简洁拆图
library(ggplot2)
library(dplyr)
Attaching package: 'dplyr'
The following objects are masked from 'package:stats':

    filter, lag
The following objects are masked from 'package:base':

    intersect, setdiff, setequal, union
mpg_filtered <- mpg |>
filter(class %in% c("compact", "midsize", "suv"))
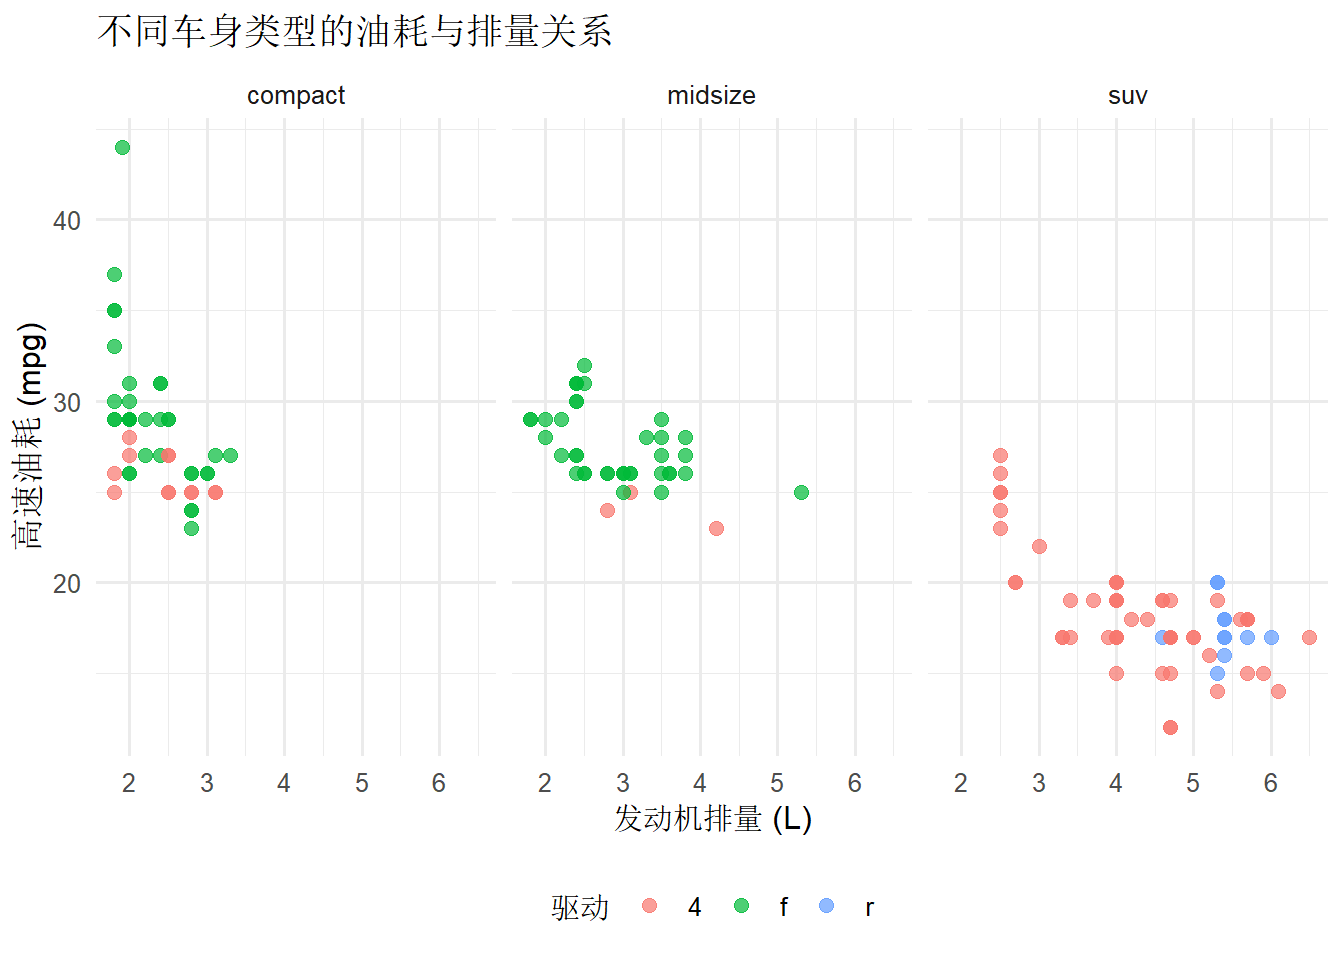
ggplot(mpg_filtered, aes(x = displ, y = hwy, color = drv)) +
geom_point(alpha = 0.7, size = 2.3) +
facet_wrap(~ class, ncol = 3) +
labs(
title = "不同车身类型的油耗与排量关系",
x = "发动机排量 (L)",
y = "高速油耗 (mpg)",
color = "驱动"
) +
theme_minimal(base_size = 12) +
theme(legend.position = "bottom")
ncol / nrow 控制布局,适配屏幕宽度。- 想让每个分面有独立坐标轴,可设置
scales = "free_y" 或 "free"。
facet_grid:二维交叉的全视角比较
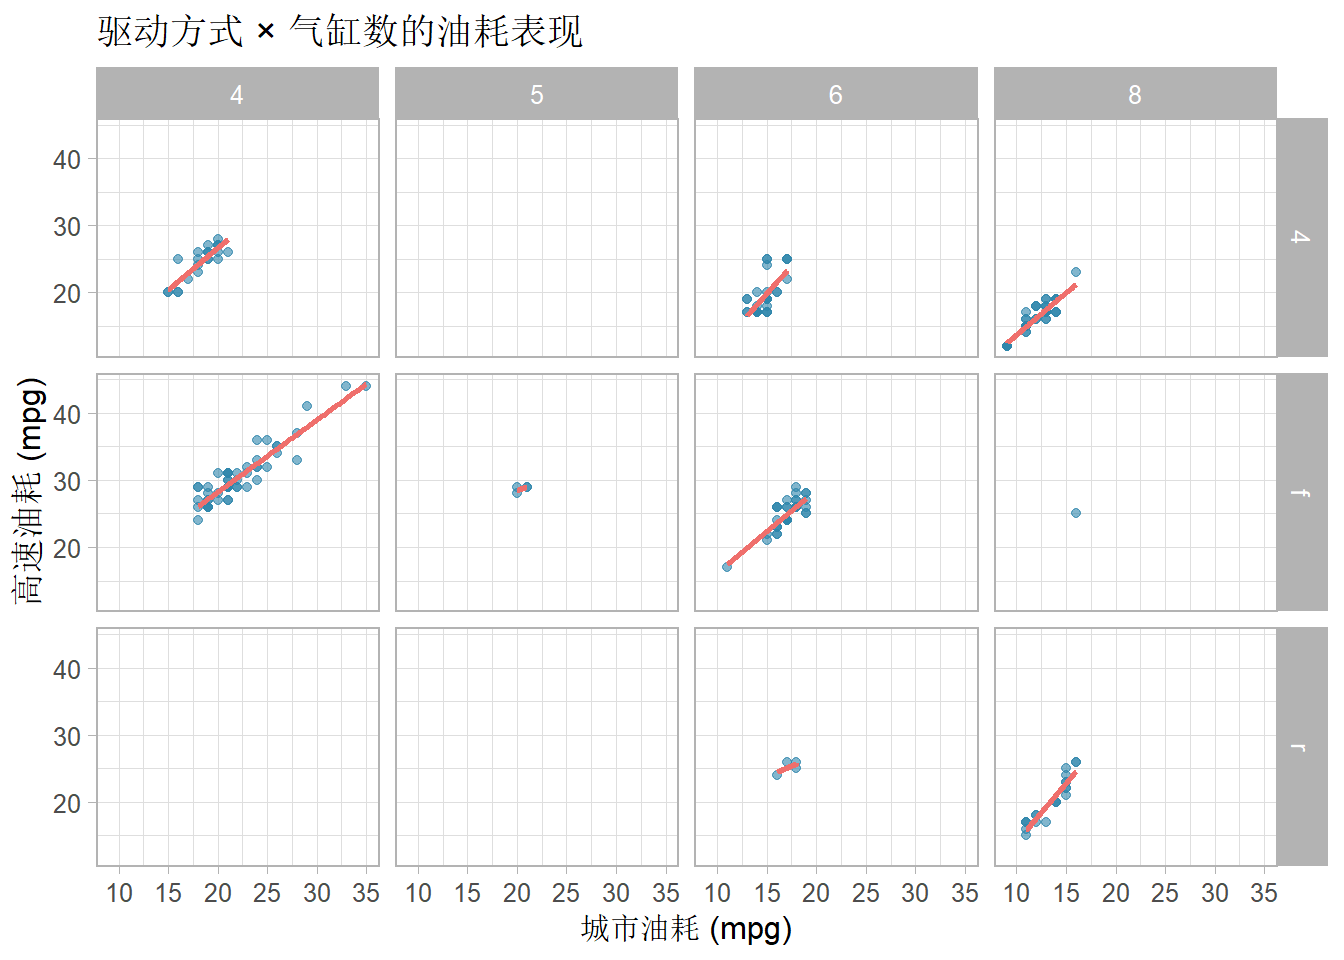
ggplot(mpg, aes(x = cty, y = hwy)) +
  geom_point(alpha = 0.6, color = "#2E86AB") +
  geom_smooth(method = "lm", se = FALSE, color = "#EF6F6C") +
  facet_grid(rows = vars(drv), cols = vars(cyl)) +
  labs(
    title = "驱动方式 × 气缸数的油耗表现",
    x = "城市油耗 (mpg)",
    y = "高速油耗 (mpg)"
  ) +
  theme_light(base_size = 12)
`geom_smooth()` using formula = 'y ~ x'
vars() 语法可以一次指定多个变量,例如 cols = vars(year, class)。- 若某一维只想按是否缺失切分,可用
cut_number() 或 if_else() 创建新变量后再分面。
定制分面标签与顺序
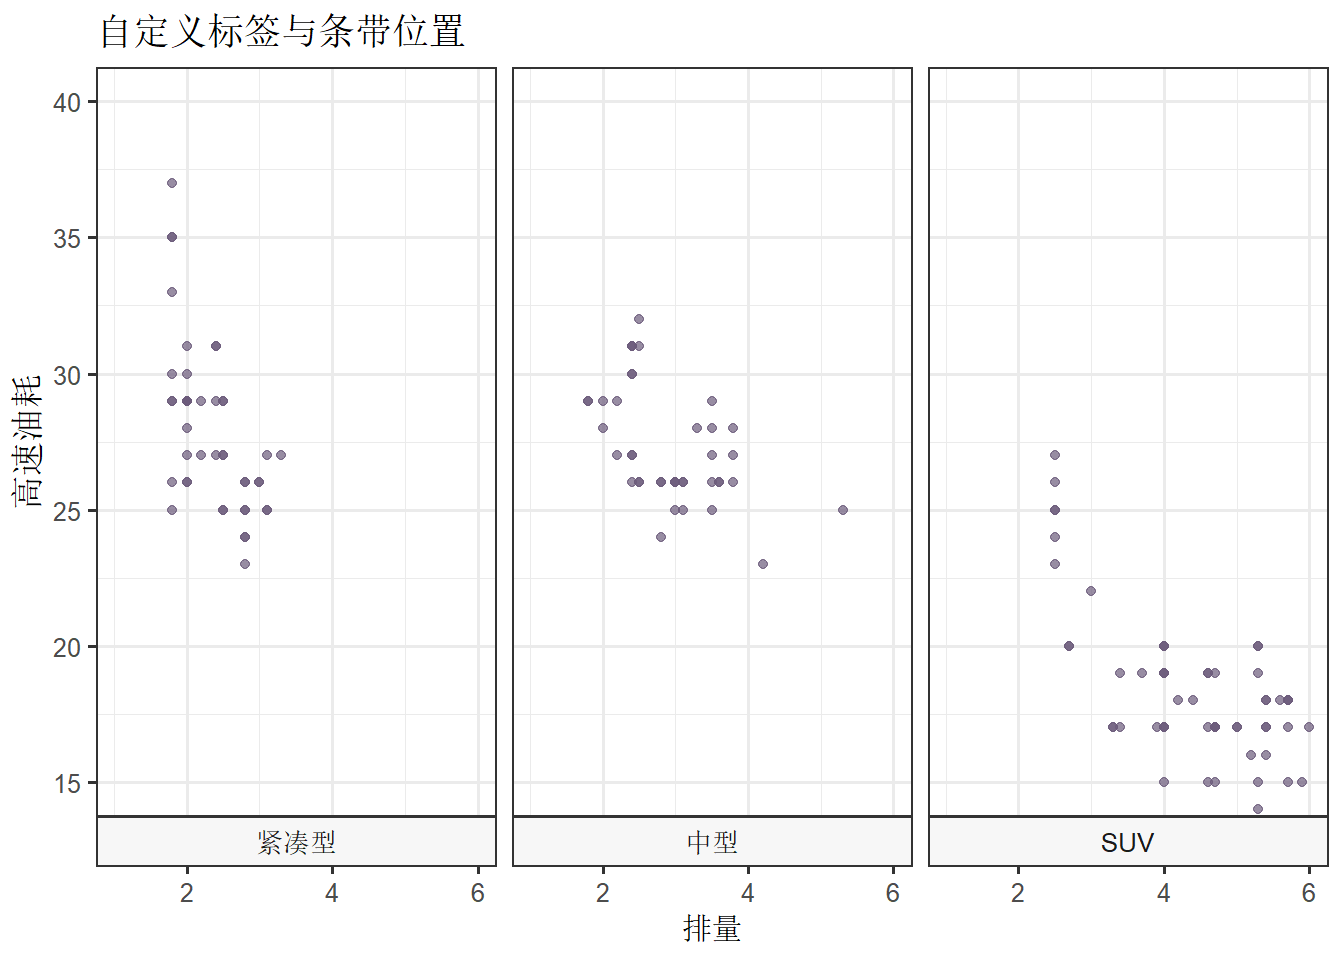
class_labels <- c(
  compact = "紧凑型",
  midsize = "中型",
  suv = "SUV"
)

ggplot(mpg_filtered, aes(x = displ, y = hwy)) +
  geom_point(color = "#6C5B7B", alpha = 0.7) +
  facet_wrap(
    ~ class,
    labeller = as_labeller(class_labels),
    strip.position = "bottom"
  ) +
  scale_x_continuous(limits = c(1, 6)) +
  coord_cartesian(ylim = c(15, 40)) +
  labs(
    title = "自定义标签与条带位置",
    x = "排量",
    y = "高速油耗"
  ) +
  theme_bw(base_size = 12) +
  theme(strip.background = element_rect(fill = "#F7F7F7"))
Warning: Removed 2 rows containing missing values or values outside the scale range
(`geom_point()`).
labeller 接受命名向量或函数,帮助输出更友好的中文标签。strip.position 可放到 "bottom" / "left" / "right",配合 theme() 微调条带样式。coord_cartesian() 保持原始数据范围的同时进行缩放,避免数据被裁掉。
实战建议
- 先明确比较的维度数量,选对
facet_wrap 或 facet_grid。
- 控制每个分面内的数据量,必要时先筛选或聚合。
- 别忘了添加解释性的标题和标注,让读者知道该关注什么。