library(ggplot2)
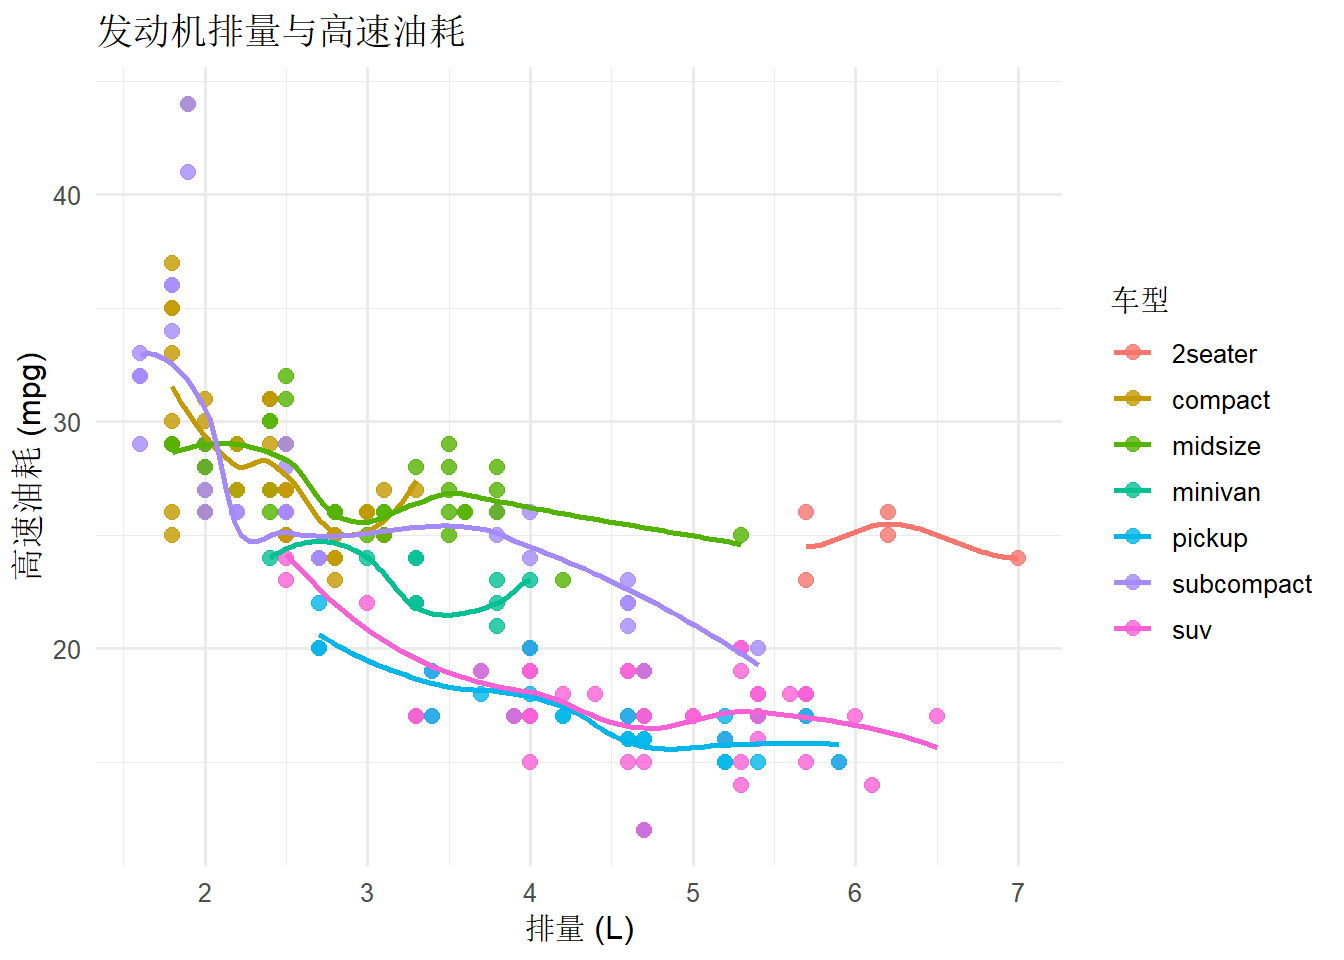
ggplot(mpg, aes(x = displ, y = hwy, color = class)) +
geom_point(size = 2.5, alpha = 0.8) +
geom_smooth(method = "loess", se = FALSE) +
labs(
title = "发动机排量与高速油耗",
x = "排量 (L)",
y = "高速油耗 (mpg)",
color = "车型"
) +
theme_minimal(base_size = 12)
`geom_smooth()` using formula = 'y ~ x'
Warning in simpleLoess(y, x, w, span, degree = degree, parametric = parametric,
: span too small.  fewer data values than degrees of freedom.
Warning in simpleLoess(y, x, w, span, degree = degree, parametric = parametric,
: pseudoinverse used at 5.6935
Warning in simpleLoess(y, x, w, span, degree = degree, parametric = parametric,
: neighborhood radius 0.5065
Warning in simpleLoess(y, x, w, span, degree = degree, parametric = parametric,
: reciprocal condition number 0
Warning in simpleLoess(y, x, w, span, degree = degree, parametric = parametric,
: There are other near singularities as well. 0.65044
Warning in simpleLoess(y, x, w, span, degree = degree, parametric = parametric,
: pseudoinverse used at 4.008
Warning in simpleLoess(y, x, w, span, degree = degree, parametric = parametric,
: neighborhood radius 0.708
Warning in simpleLoess(y, x, w, span, degree = degree, parametric = parametric,
: reciprocal condition number 0
Warning in simpleLoess(y, x, w, span, degree = degree, parametric = parametric,
: There are other near singularities as well. 0.25